Whistle time specifics test section
WR Teacher is subdivided in 2 parts:
- Recorder: it records audio and noise and lets the user adjust mic gain according to the environmental situation.
. Learning section: starting from recorder samples and builds examples, it launches the learning loop in order to adjust neuron’s weight and to provide a visual representation to let the user control neuron’s weight, hysteresis and the frequency mask.
Let’s examine the interface:
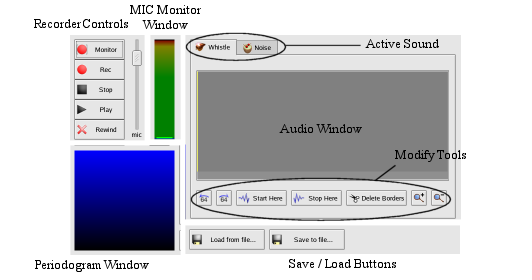
It provides some checks for the recording, the playing or the deletion of all the already recorded samples and for the regulation of the microphone level.
|
|
It brings the recorder in “Monitor” state. In this state, the recorder reads 64 samples from the microphone, finds out the peak sample and draws it in the Mic Monitor Window. Samples, which have been read in “Monitor” state are not recorded. This state can be interrupted by pressing the “Stop” button or the “Rec” button. |
|
|
It brings the recorder in “Rec” state and begins recoding samples. This state, which can be interrupted by pressing “Stop”, is automatically interrupted when the storage capacity is reached. Before leaving “Rec” state, Audio Window is refreshed and recorded samples are visualized. Every time that “Rec” button is pressed, previously recorded samples are erased and substituted with new samples. |
|
|
It brings the recorder in “Play” sate, playbacks recorded samples and draws in Periodogram Window the periodogram in real-time. This state can be interrupted by pressing “stop” and is automatically left when playback finishes. |
|
|
It interrupts “Monitor”, “Rec” and “Play” states and brings the recorder in “Stop” state. |
|
|
It erases recorded samples. |
|
|
When the user moves this slider, the recorder changes mixer’s input gain (IGAIN) feature. |
Recorder controls act on both whistle and noise, according to the active sound in Audio Window.
It works only in “Monitor” state.
It gives a graphical visualisation of the peak level, which has been reached by reading 64 samples from the microphone.
A blue dash indicates the peak level reached during the last entrance in “Monitor” state.
It visualises recorded sounds (whistle and noise) and provides functions that can edit them.
Active sound: It sets whether the active sound is whistle or noise and displays the corresponding page.It can be changed only in “Stop” state.
Audio Window: It gives a graphical representation of the sound.It provides a horizontal scroll-bar when the zoom is deeper than 1:1.
Modify tools:
|
|
It moves edit point 64 samples back (if possible). |
|
|
It moves edit point 64 samples forward (if possible). |
|
|
It makes the selection start at edit point. If stop point is not specified, the selection finishes at the end of the sound. Shortcut: left-click on Audio Window where we want the selection to start. |
|
|
It makes the selection stop at the edit point. If start point is not specified, the selection starts at the beginning of the sound. Shortcut: right-click on Audio Window where we want the selection to stop. |
|
|
It erases all samples that are external to the selection. |
|
|
It increases the zoom in Audio Window. |
|
|
It decreases the zoom in Audio Window. |
It works only in “Play” state.
It draws the periodogram in real-time while the sound is being played.
This Window uses a Log10 compression on the y-axis to compensate the large excursion of periodogram samples (from 0 to (64*128)2/64 ).
Values that are smaller than 1 are clamped to 1 (Log10 (1) = 0 in the graph).
File 1/0 handling to load/save sounds and microphone input gain level.
A proprietary format *.wrs has been chosen to keep whistle, noise and miclevel together in a single file.
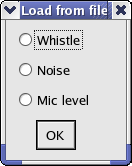
During save/load operations, WR visualises the following window:
|
|
During Saving: |
check items you want to save and click OK. Items that are not there, don’t work (for instance, if whistle buffer is empty, th whistle checkbox will be disabled).
|
|
During Loading: |
check items you want to load from file and click OK. Items that are not there, don’t work (for instance, if whistle has not been saved in the selected file, the whistle checkbox will be disabled).
|
Let’s examine the interface:
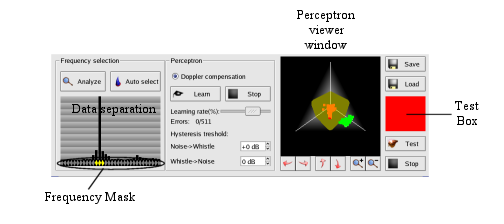
It calculates data separation, visualises it in the graph and let the user select which periodogram’s samples has to be used.
|
|
It analyses each sample of the periodogram and retrieves data separation. Whistle and Noise sounds are subdivided in 64-samples sequences; each of these sequences is transformed and periodogram is calculated. Once data separation has been calculated, whistle and noise sounds in the recording section are converted into a set of examples which is the input of the perceptron's learning loop. Every time a new sound (whistle or noise) is recorded - or loaded from file – in the recording section, the user must click this button; otherwise, perceptron will keep using old examples in his learning loop. In this way, 2 sets of values (one set for whistle and one set for noise) are identified for each sample of the periodogram. The Whistle and the Noise sets are called Wk and Nk, where k is the frequency index (or periodogram's sample), data separation is calculated as:
These values are represented in the graph, through percentage (each band is 10% high). The perceptron viewer window is also updated to show the changes.
|
|
|
It selects automatically the 3 frequencies that give a better data separation and updates the frequency mask. The user can change the frequency mask left-clicking in the graph (on bar or on the marker): samples indicated with a yellow marker become inputs of the perceptron. Every time frequencies are changed, perceptron viewer window is updated. |
Controls perceptron’s learning loop, hysteresis and Doppler compensation.
|
|
If it is selected, it extends perceptron’s internal frequency mask by one sample upward and downward. As Doppler effect can shift the periodogram up or down by one samples, perceptron will use for added samples the same weights of the previous or next input. For example: fMask: 0 0 0 0 0 0 0 0 0 0 0 0 0 0 0 0 0 0 1 1 1 0 0 0 0 0 0 0 0 0 0 0 radius - - - - - - - - - - - - - - - - - - a b c - - - - - - - - - - - will be extended to fMask: 0 0 0 0 0 0 0 0 0 0 0 0 0 0 0 0 0 1 1 1 1 1 0 0 0 0 0 0 0 0 0 0 radius - - - - - - - - - - - - - - - - - a a b c c - - - - - - - - - - |
|
|
It starts learning loop using the learning rate set by the “Learing Rate” slider. It brings the teacher in “Learn” state, which can be interrupted by pressing the “Stop learn” button and is automatically left when perceptron completes a learning cycle on examples without mistakes (optimum vector has been reached) After each cycle on data, perceptron viewer window is updated, providing an animated representation of the learning. |
|
|
It interrupts the learning loop, bringing the teacher in “Stop” state. |
|
|
It lets the user adjust the learning rate (from 0 to 0.1). This slider is active also in “Learn” state, to let the user change the learning rate during the learning loop. |
|
|
Let the user set the Noise->Whistle (turn-on) and Whistle->Noise (turnoff) thresholds, expressed in dB. When thresholds are changed, perceptron viewer window is updated to show the changes. |
It provides a graphical Log10 representation of examples and perceptron's weight vector.
Whistle examples are indicated with green points.
Noise examples are indicated with red points.
Yellow ellipsoid is the perceptron's separation surface.
Green and red ellipsoids are extensions of the perceptron's surface due, respectively, to the turn-on and turnoff thresholds.
Perceptron viewer uses, as axes, the first three selected frequencies of the frequency mask; other frequencies are ignored.
If selected frequencies are less than three, axis are left unused and example space is reduced to a plane or a line.
|
|
Turn the camera left/right, keeping it pointed on the origin. |
|
|
Move the camera up / down, keeping it pointed on the origin. |
|
|
Zoom perceptron viewer vindow in/out. |
It lets the user test the perceptron.
During the test, the test box is red when the perceptron outputs “Noise” and becomes green when it outputs “Whistle”.
|
|
It brings the teacher in “Test” state and begins the test loop, which can only be interrupted by pressing the “Stop” button below. During the test loop, WR reads 64 samples from the microphone, calculates the periodogram (only samples whose frequency is set to 1 in the perceptron's frequency mask are calculated) and passes it as input to the perceptron, which calculates his output (Whistle or Noise). The test box is immediately updated |
|
|
It interrupts the test loop, bringing the teacher in the “Stop” state. |
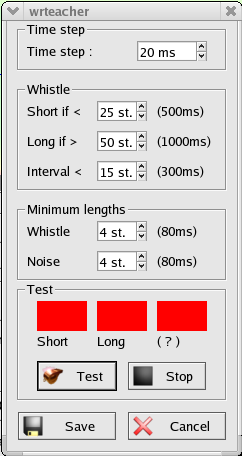
Let the user save or load a perceptron; before saving a perceptron, the Whistle Time Specifics window is displayed.
The perceptron is saved in a *.wrp file, which can be read through WR Teacher or imported by WR to be used during a RoboCup's competition.
When the user loads a perceptron, every feature is imported but examples.
So, weights, frequency mask, thresholds and Doppler compensation is loaded, the data separation section is redrawn to display the new frequency mask (with old examples), perceptron viewer window is redrawn to show the new perceptron's surfaces but continues to draw the old examples, the “Doppler compensation” radio button in “Perceptron” section is updated.
Whistle time specifics test section
|
|
This section lets the user set whistle's time specifics.
|